Cultural Systems, La Lettura, 2019-ongoing
Beginning in 2019, a collaboration with La Lettura, Corriere della Sera's cultural supplement has given rise to a series of intricate data visualizations revealing data around weekly top global artists, paired with contextual articles, together blending art with information and popular culture.
The Periodic Table of the Discoverer of the Elements
Within the series, the work titled Periodic Table of the Discoverer of the Elements commemorated UNESCO's International Year of the Periodic Table in 2019. This visualization revisited the iconic Periodic Table, spotlighting the scientists behind its discoveries and tracing its evolution from conception to its contemporary significance.


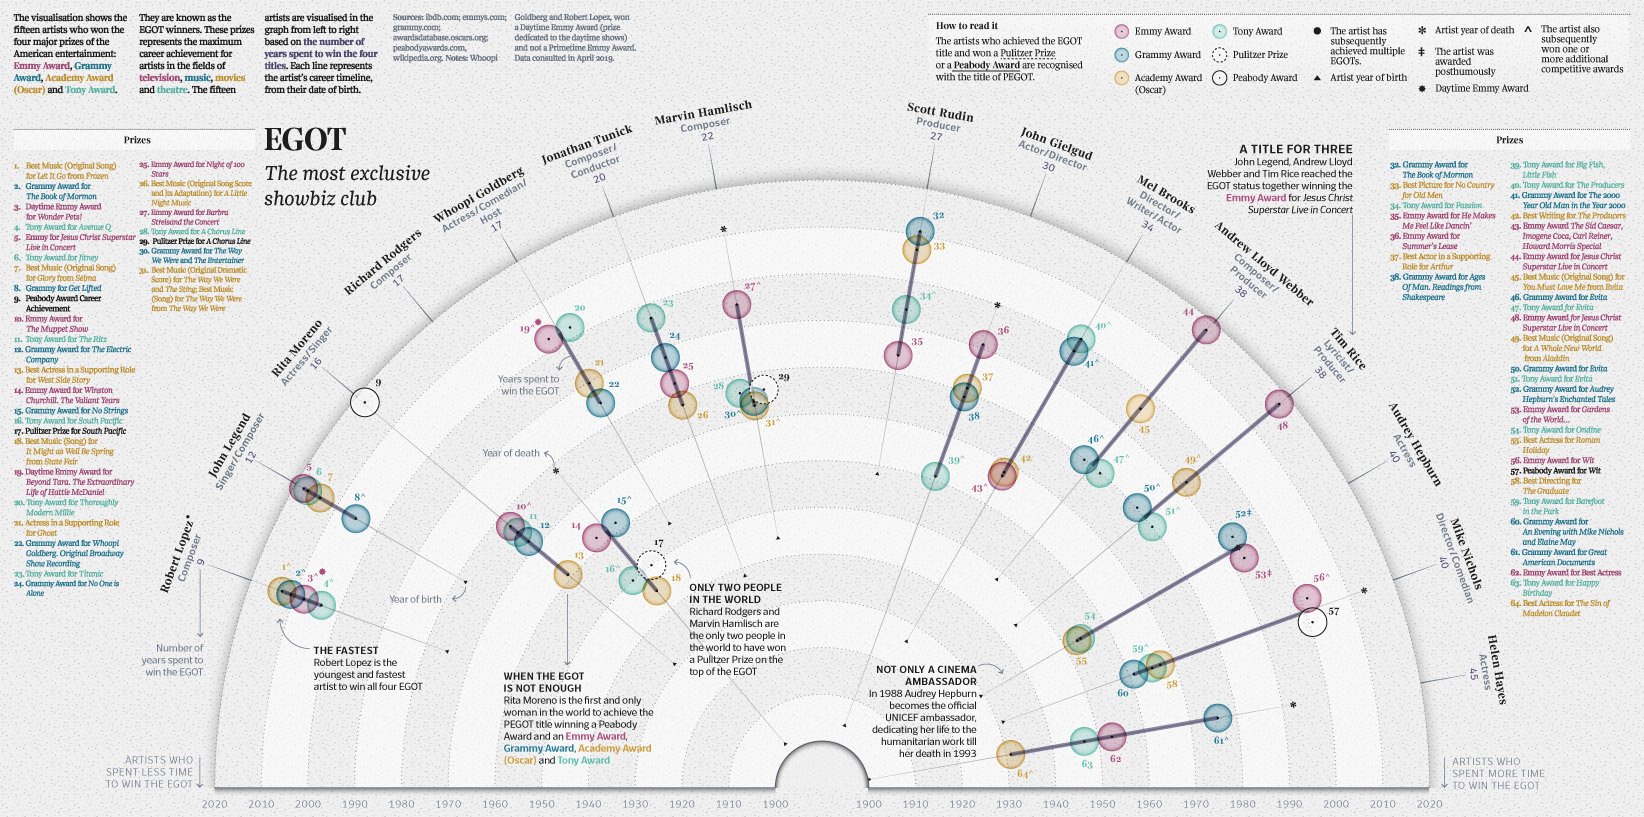
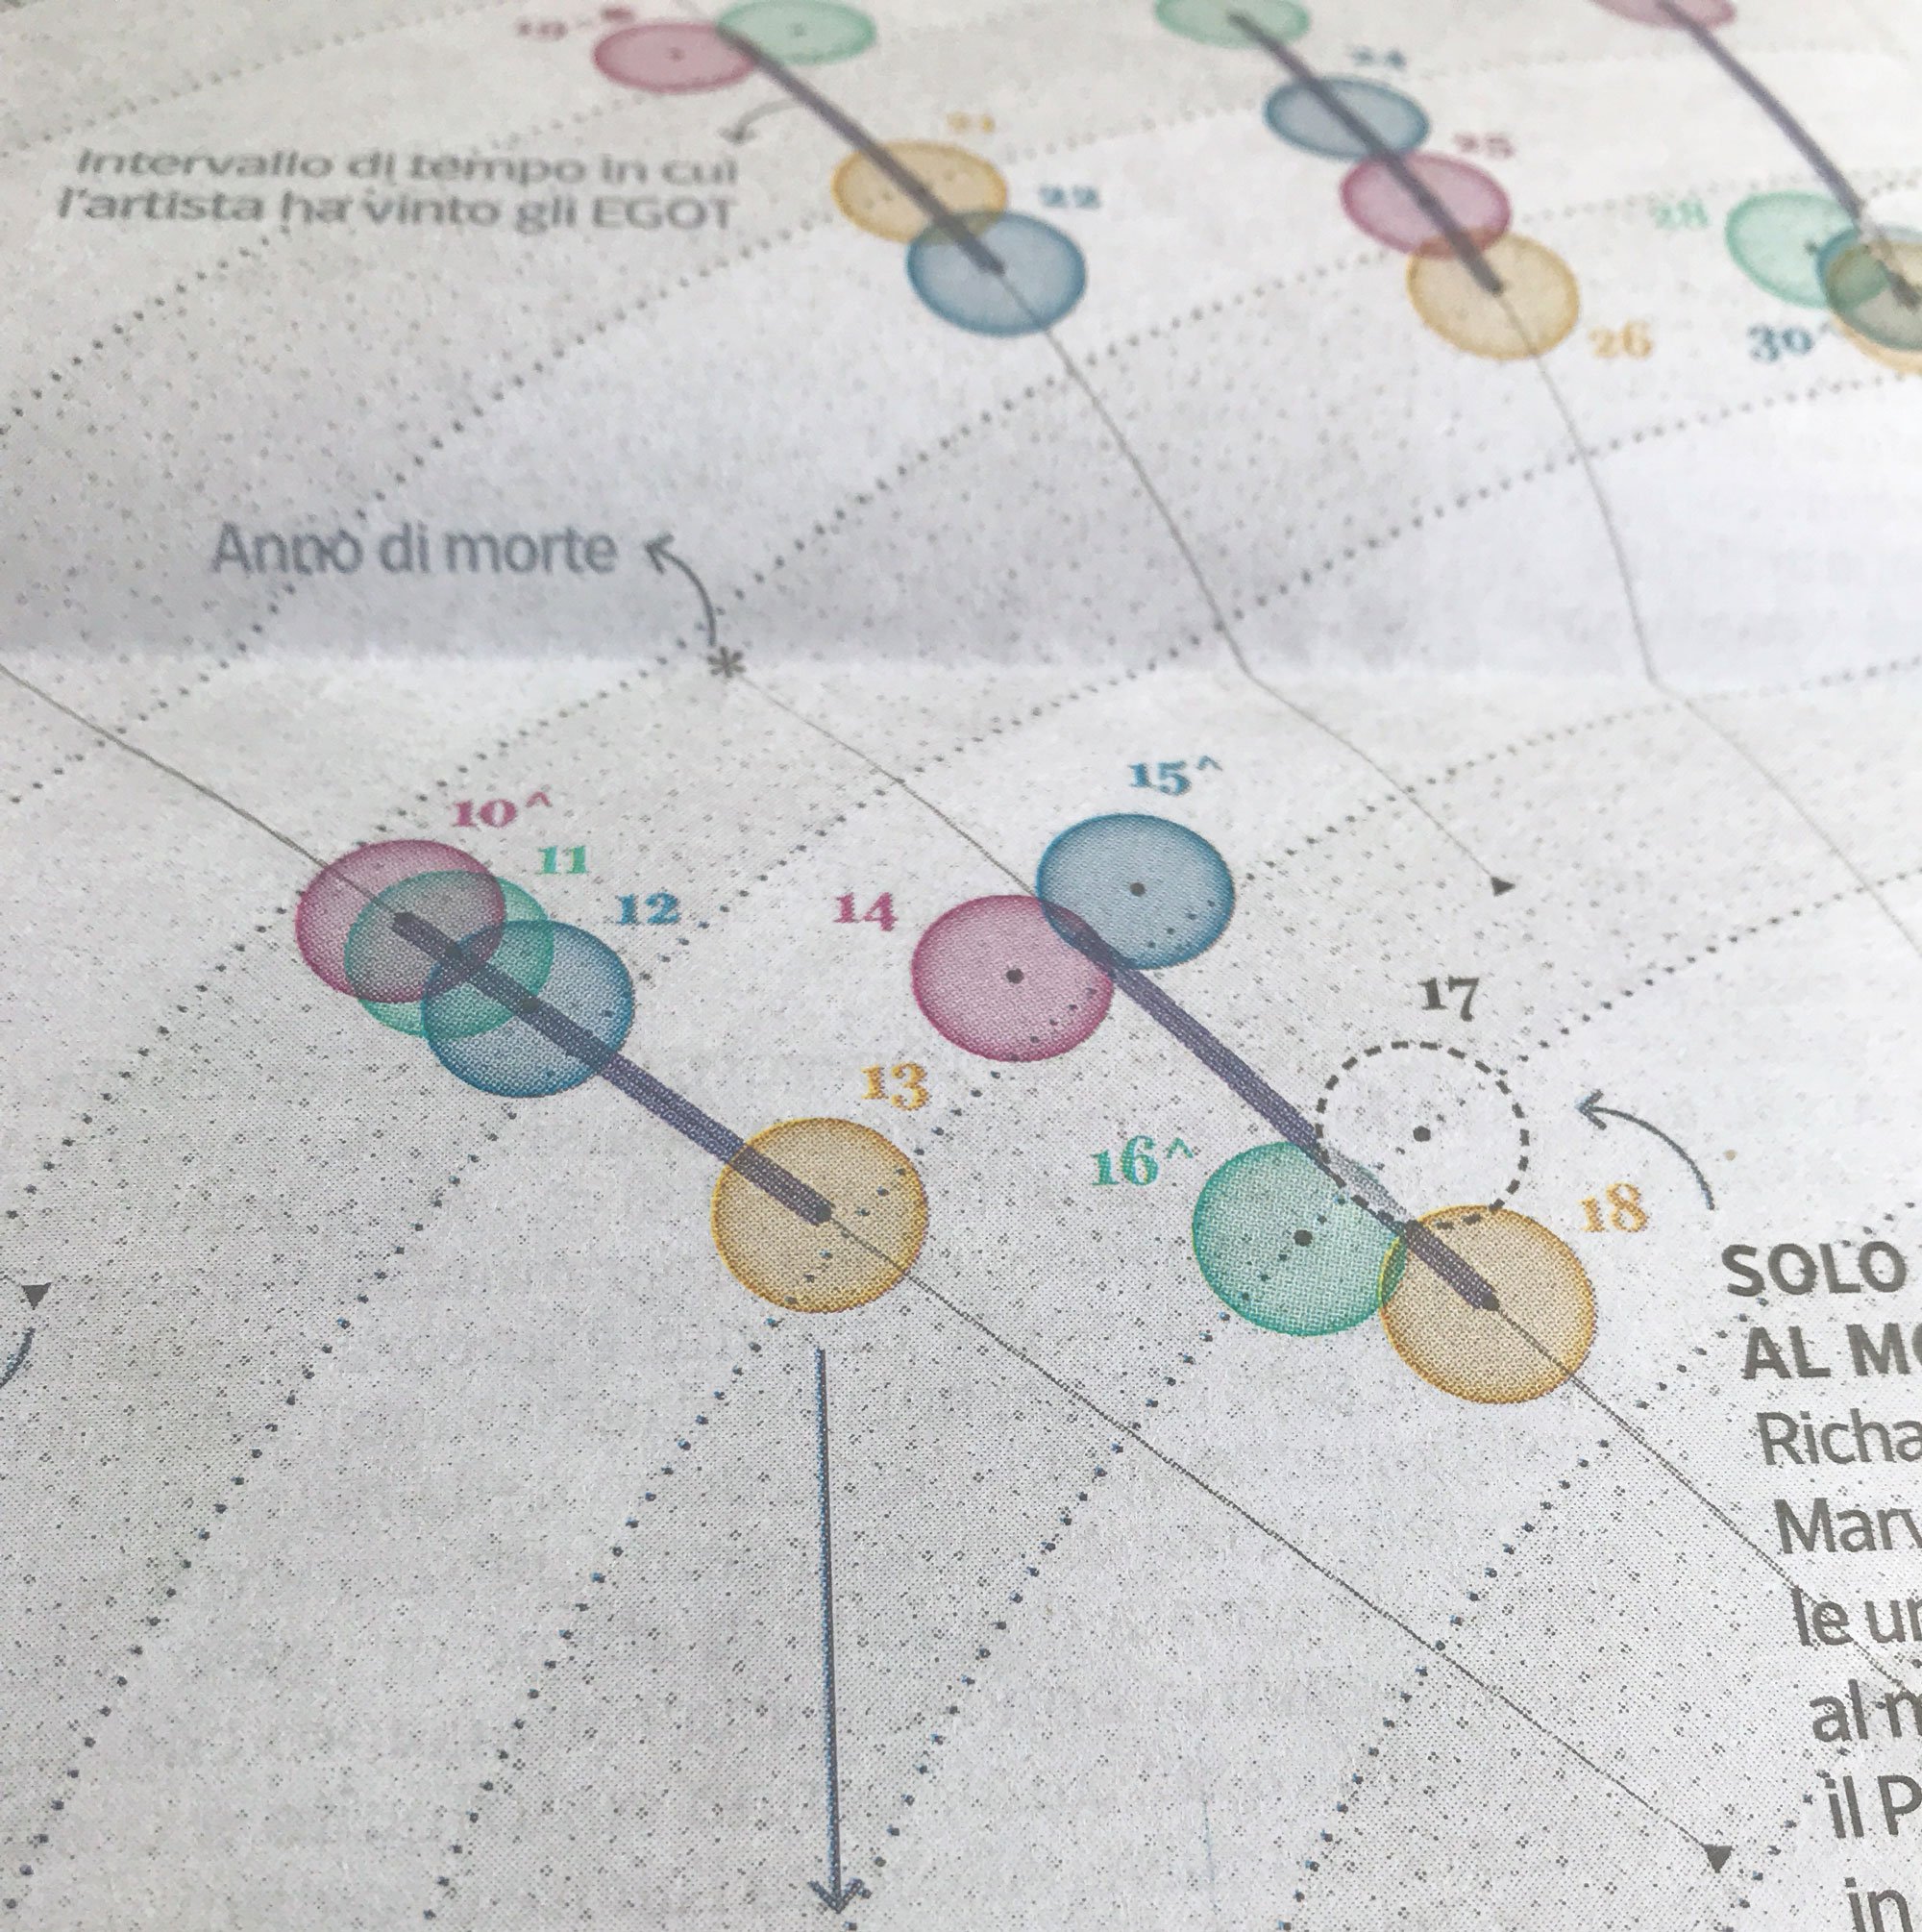
EGOT Club, The most exclusive showbiz club
Another notable work was the EGOT Club, which focused on the exclusive group of individuals achieving Emmy, Grammy, Oscar, and Tony Awards. This visual journey detailed the esteemed EGOT winners, highlighting their milestones and the cultural impact of their achievements.

Alien Species
A visualization on Alien Species shed light on the ecological impact of invasive plants and animals introduced into new environments, disrupting ecosystems and threatening biodiversity.


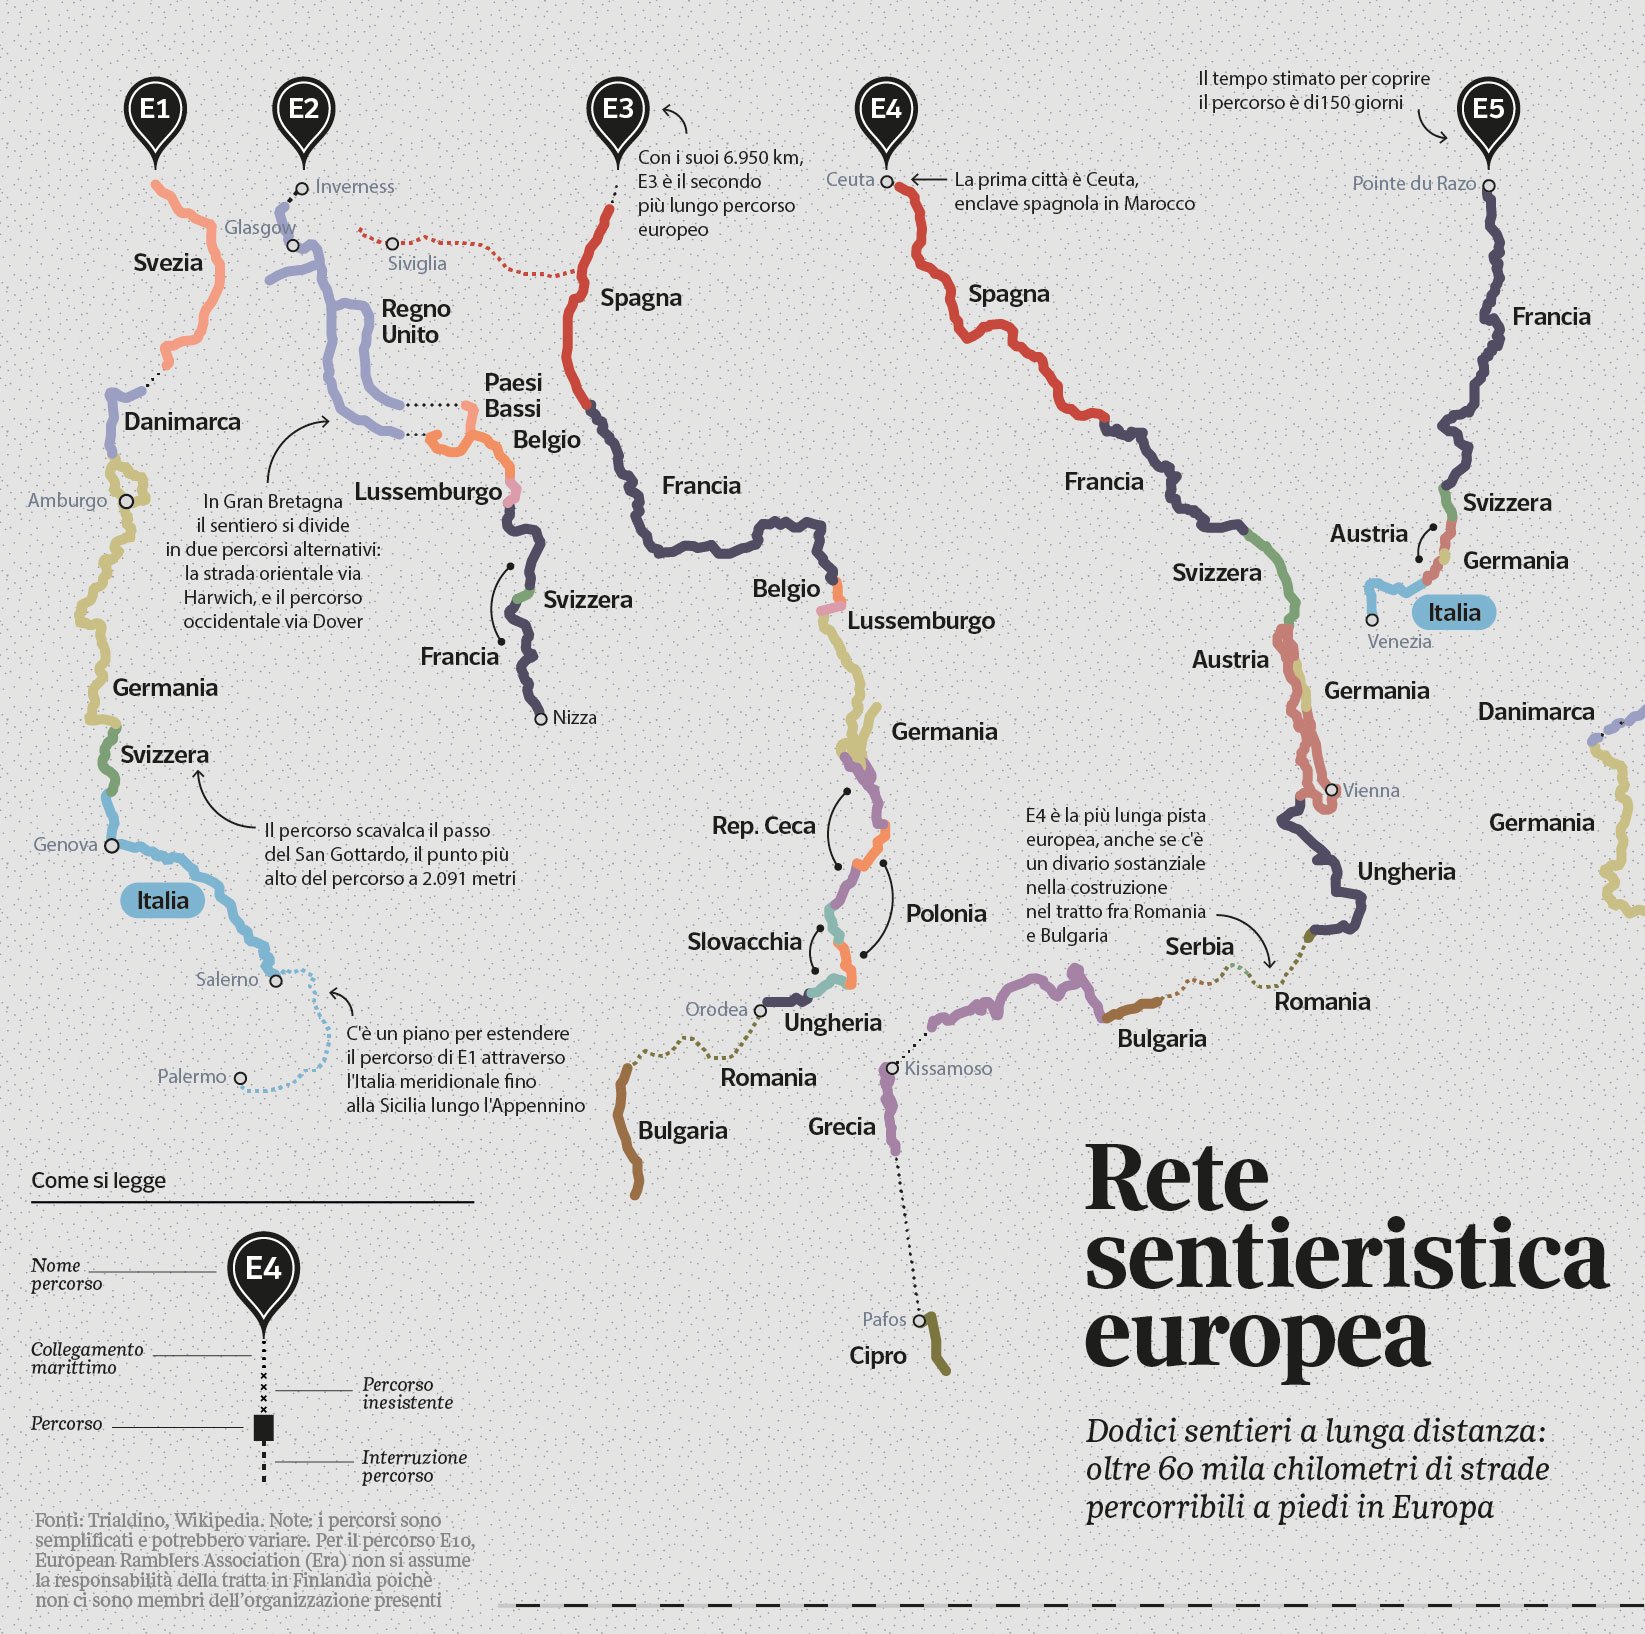
European long-distance paths
The exploration of European long-distance paths was the subject of another visualization, highlighting twelve scenic routes spanning 60,000 kilometres across 28 countries, inviting enthusiasts to explore nature's beauty and enhance cognitive abilities through walking.


1969, Sellerio – A Vast Array of Literature
In another edition, a tribute to the 50th anniversary of Sellerio held during the Salone del Libro in Turin was visualised, where the renowned publishing house celebrated for titles like the Commissario Montalbano series, reflected on its literary contributions.

National Anthems, year of adoption per country
Lastly, the National Anthems visualization, timed with the Tokyo Olympics, chronologically arranged participating nations based on the adoption year of their national anthems, showcasing the rich cultural tapestry of countries joining the global event.
